Metolius offers two key analytic controls: Filter and Compare. The sections below explain how these controls work to provide streamlined data analysis for incredible insights fast.
Accessing Analytics
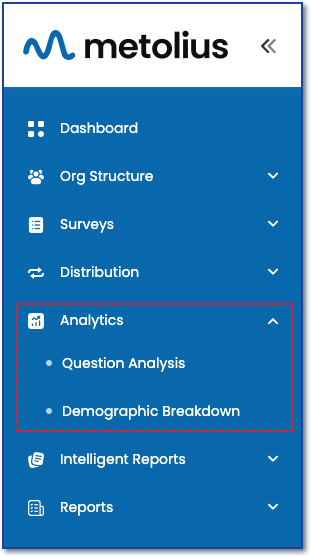 In the Analytics menu on the main navigation sidebar, select Question Analysis to open the data analysis workspace.
DATA ANALYSIS OPTIONS
See the following articles for more information on getting familiar with the three question categories for data analysis and how to access Question Analysis for Data Analytic and Information Gathering questions.
See Understanding the Question Analysis Framework for a deep dive into all the options within Question Analysis.
- The access the Questions Analysis page, first make selections from the dropdown menus:
-
Company Name - Select a Company if on on the Enterprise plan; Otherwise, your company will auto populate.
-
Survey - Choose a survey to analyze. Only surveys that are active or closed from receiving responses will appear.

-
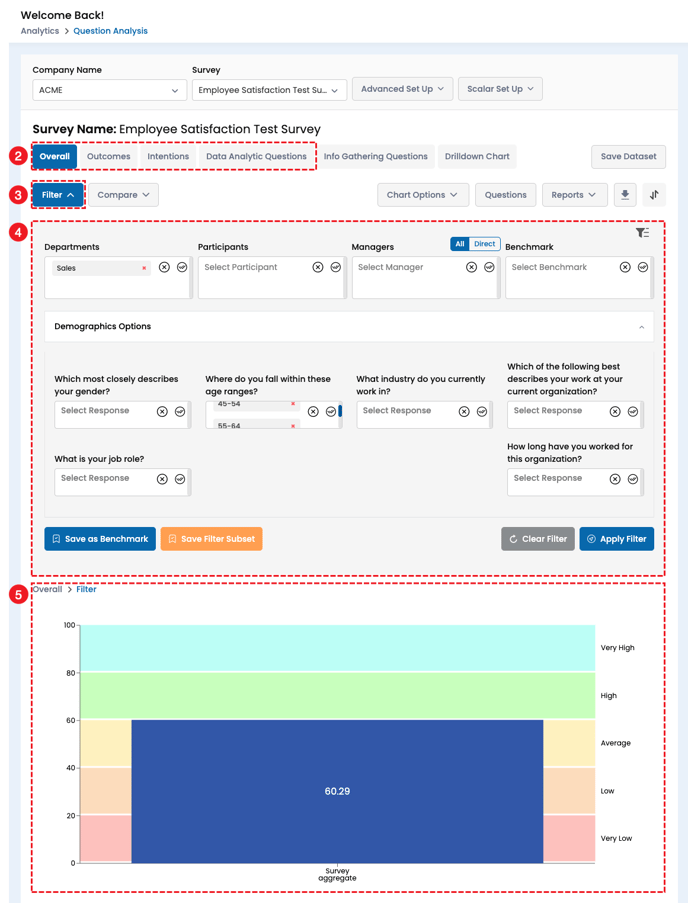
Filter - Narrow down your View
Filter is available when a survey is selected and the data is visible.
-see screenshot below-
2. Filterable segments include (six total):
- Overall – Total score across all analytic questions. These are questions that have been assigned a numerical value and are different than Information Gathering questions.
-
Outcomes – First-level categories.
-
Intentions – Sub-categories under Outcomes.
-
Data Analytic Questions – Individual numeric-rating questions within Intentions.
-
Info Gathering Questions – Non-numeric questions showing percentage responses. These populate
-
Drilldown Chart – A chart per question.
3. Filter - Click the filter button to expand the data filtering options.
4. Filter options you can apply:
-
Departments - survey-sent departments. In the example below, the sales department is selected as a filter.
-
Participants - including anonymous respondents.
-
Managers - Enterprise only, if you uploaded participants using Managerial Hierarchy, you can filter and analyze data by your company's management structure.
- Benchmarks - Any data set you save as a Benchmark will populate here. Saving a benchmark is as easy as clicking the Save Benchmark button while the data set you wish to save is displayed on the chart.
- Demographic Options - Expand this menu to view all demographic questions included in the survey. Selecting any response option—individually or in combination—will filter the chart data accordingly. In the example below, the age ranges 25–34 and 45–54 are selected, along with the Sales department filter. The aggregate score displayed, 58.94, reflects the overall survey result for employees in these age groups within the sales department.
Additional Filter actions:
- Save as Benchmark - Save the data displayed on the chart as a benchmark. Saved benchmarks can be pulled up to compare to other data sets.
- Save Filtered Subset - Save the data displayed on the chart as a filtered subset. Saved subsets can be pulled up later to compare with other data sets.
- Clear Filter - Click the clear button to remove all filters and return the chart to its default view.
- Apply Filter- Click here once all your filter selections have been made to see the results.
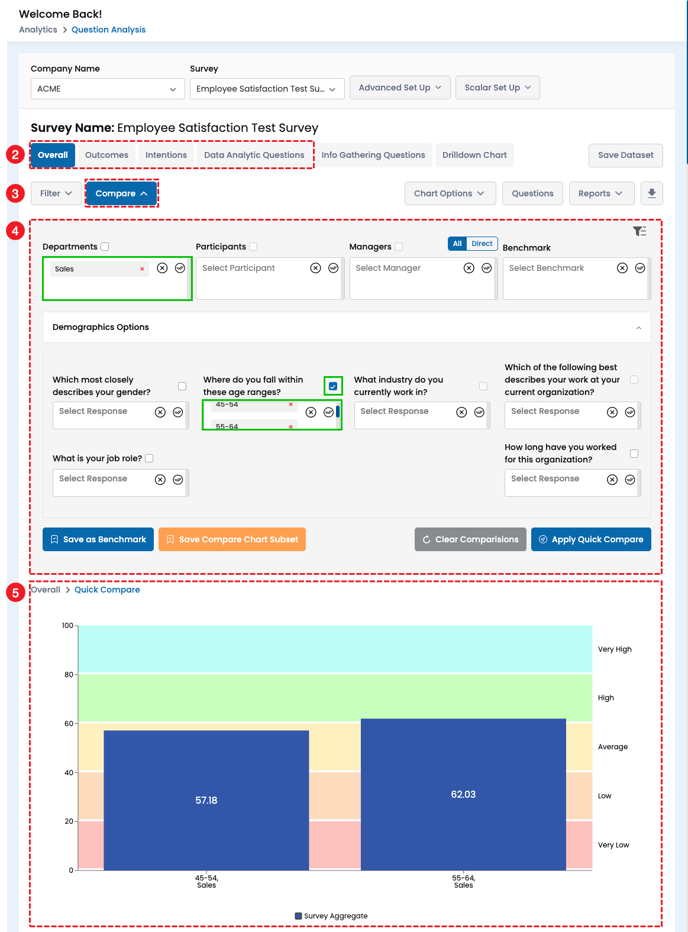
Compare - Side by Side Insights
- Start with step one above and select the survey you wish to analyze from Analytics menu > Question Analysis page.
- The Question Analysis page defaults to the Aggregate/Overall score. In contrast to the filter option, only the four segments listed below allow for data point comparison.
- Overall
- Outcomes
- Intentions
- Data Analytic Questions
- Compare - Click the compare button to expand the data comparison options.
- Note that the same options exist for compare as for filter. Comparison differs in that you can immediately compare segments to other segments. In our example below, these are highlighted in green and are the two selected age ranges among the sales department.
-
Choose the segments you want to compare by checking it's associated box.
- The response options selected for the checked question (e.g., Age Range) will be directly compared across all selected groups (e.g., Departments – Sales).
- Clear - Click the clear button to remove all filters and return the chart to its default view.
- Save as Benchmark - Save the data displayed on the chart as a benchmark. Saved benchmarks can be pulled up to compare to other data sets.
- Save Filtered Subset - Save the data displayed on the chart as a filtered subset. Saved subsets can be pulled up later to compare with other data sets.
- Clear Comparisons - Click the clear button to remove all comparisons and return the chart to its default view.
- Apply Comparison - Click here once all your comparison selections have been made to see the results.
-