Each assessment consists of data points and objects, which, along with the IR widgets, help to narrate the story of your survey.
What are Data Points?
Data points are the answers provided by those who respond to your assessment questions. Metolius arranges the responses in a structured hierarchy of participants, departments, and companies. See this article for more information on the organizational structure Metolius uses.
In the analytical charting module of Metolius, these three categories can be filtered and combined in many different ways and saved as reference or benchmark data. For instance, the overall score of the survey can be filtered by the responses to demographic questions asked in the survey –age range, tenure, or gender for example. The filtered datasets can be saved as reference data or benchmarks, allowing for comparison.
Data points are therefore the response data referenced as participants, departments, companies, reference data and benchmarks.
What are Objects?
Objects are the structural elements of the survey which Metolius refers to as questions, intentions and outcomes. These elements are the building blocks of your survey. See this article for more information on the intelligent questionnaire structure.
How does Intelligent Reporting use Data Points and Objects?
IR gives you ultimate control on how to visualize your data points and objects. Each IR widget –charts and other visualization methods– has a corresponding control panel. See this article for more information on IR widgets. Most IR widgets provide the option to display datapoints and/or objects. The control panel gives you the option of which data point or object to reflect within the widget.
IMPORTANT: The dataset saved to IR from charting defines the objects and data points that are available for selection from the IR data point and object control panels.
For example, if you filter your data in charting by a certain age range, that dataset in IR will only reflect the participants (AKA data points) who are in that age range; And only those participants will be available to choose from in the data point control panel.
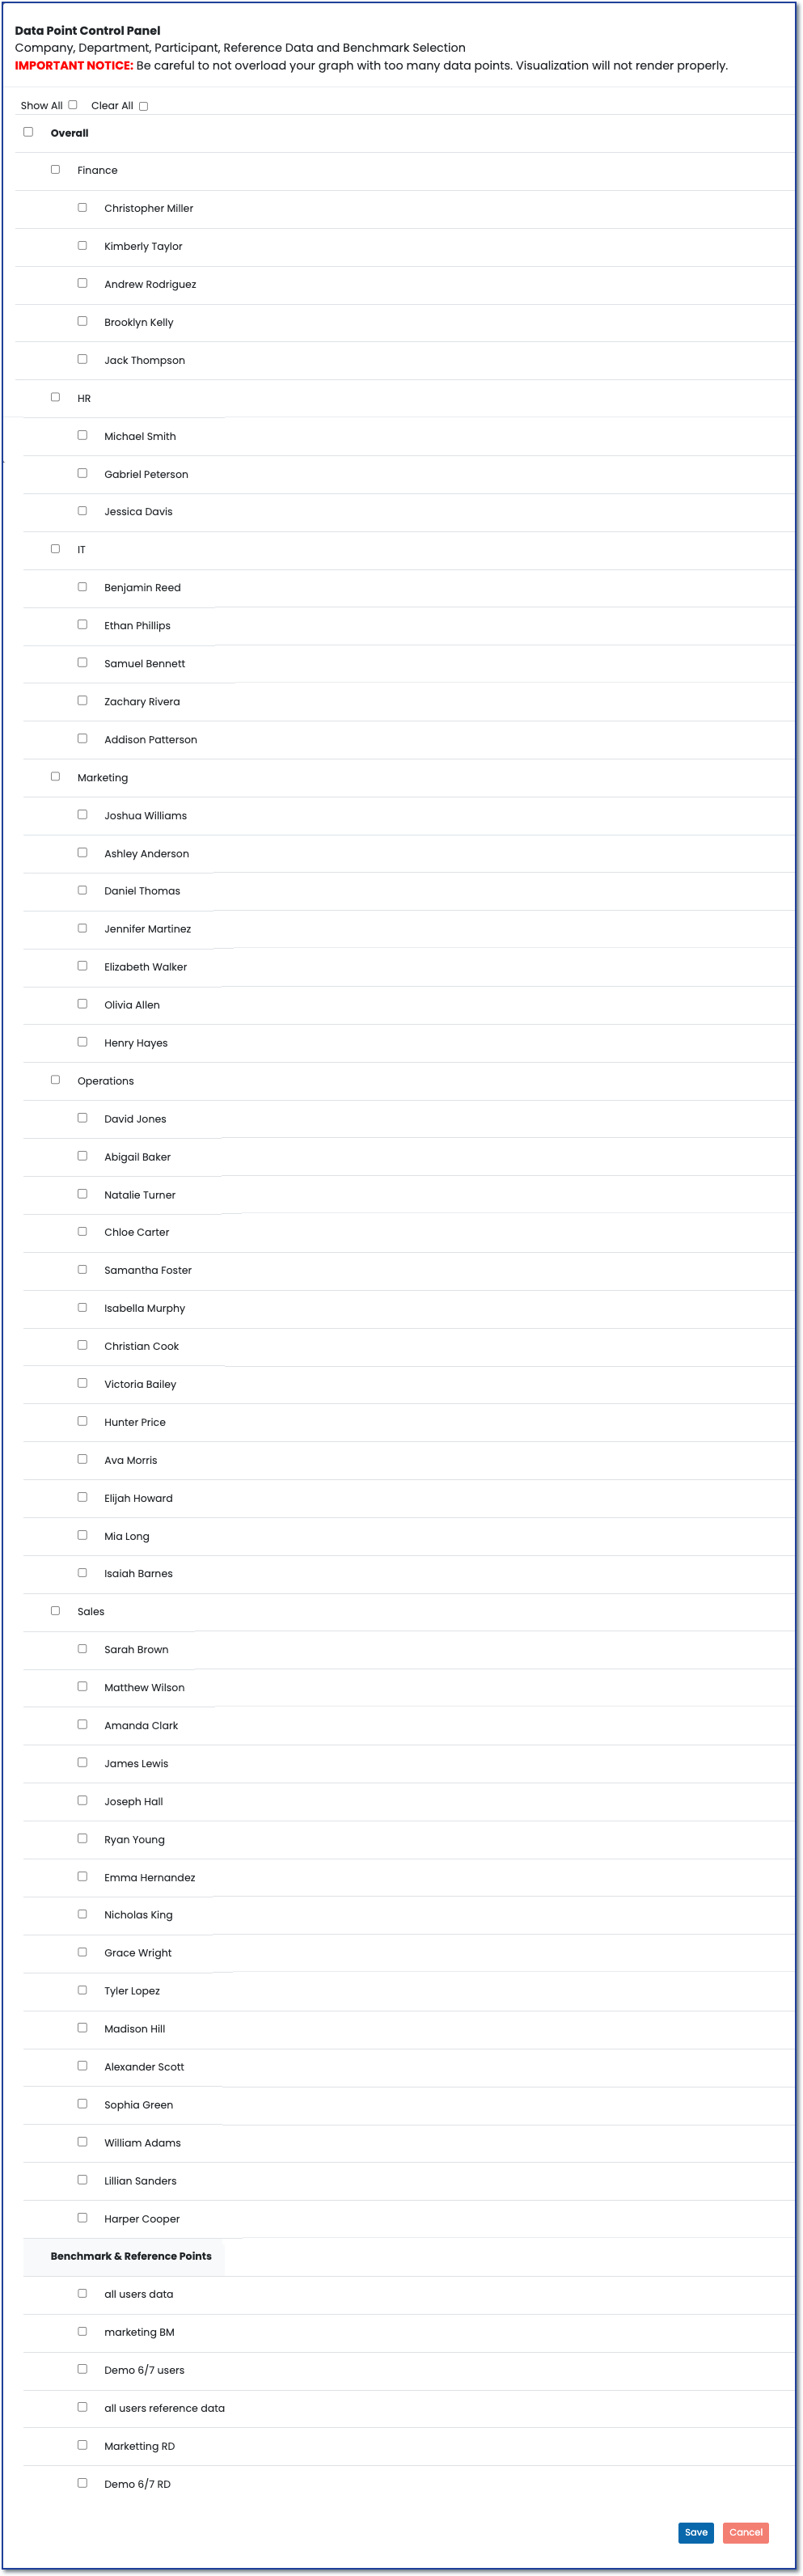
Data Point Control Panel
Again, data points are the Company, Department, Participant, Reference Data and Benchmarks available for selection. The control panel gives on a data point control have the options
Click on the image to see a complete view of the data points from an example survey.
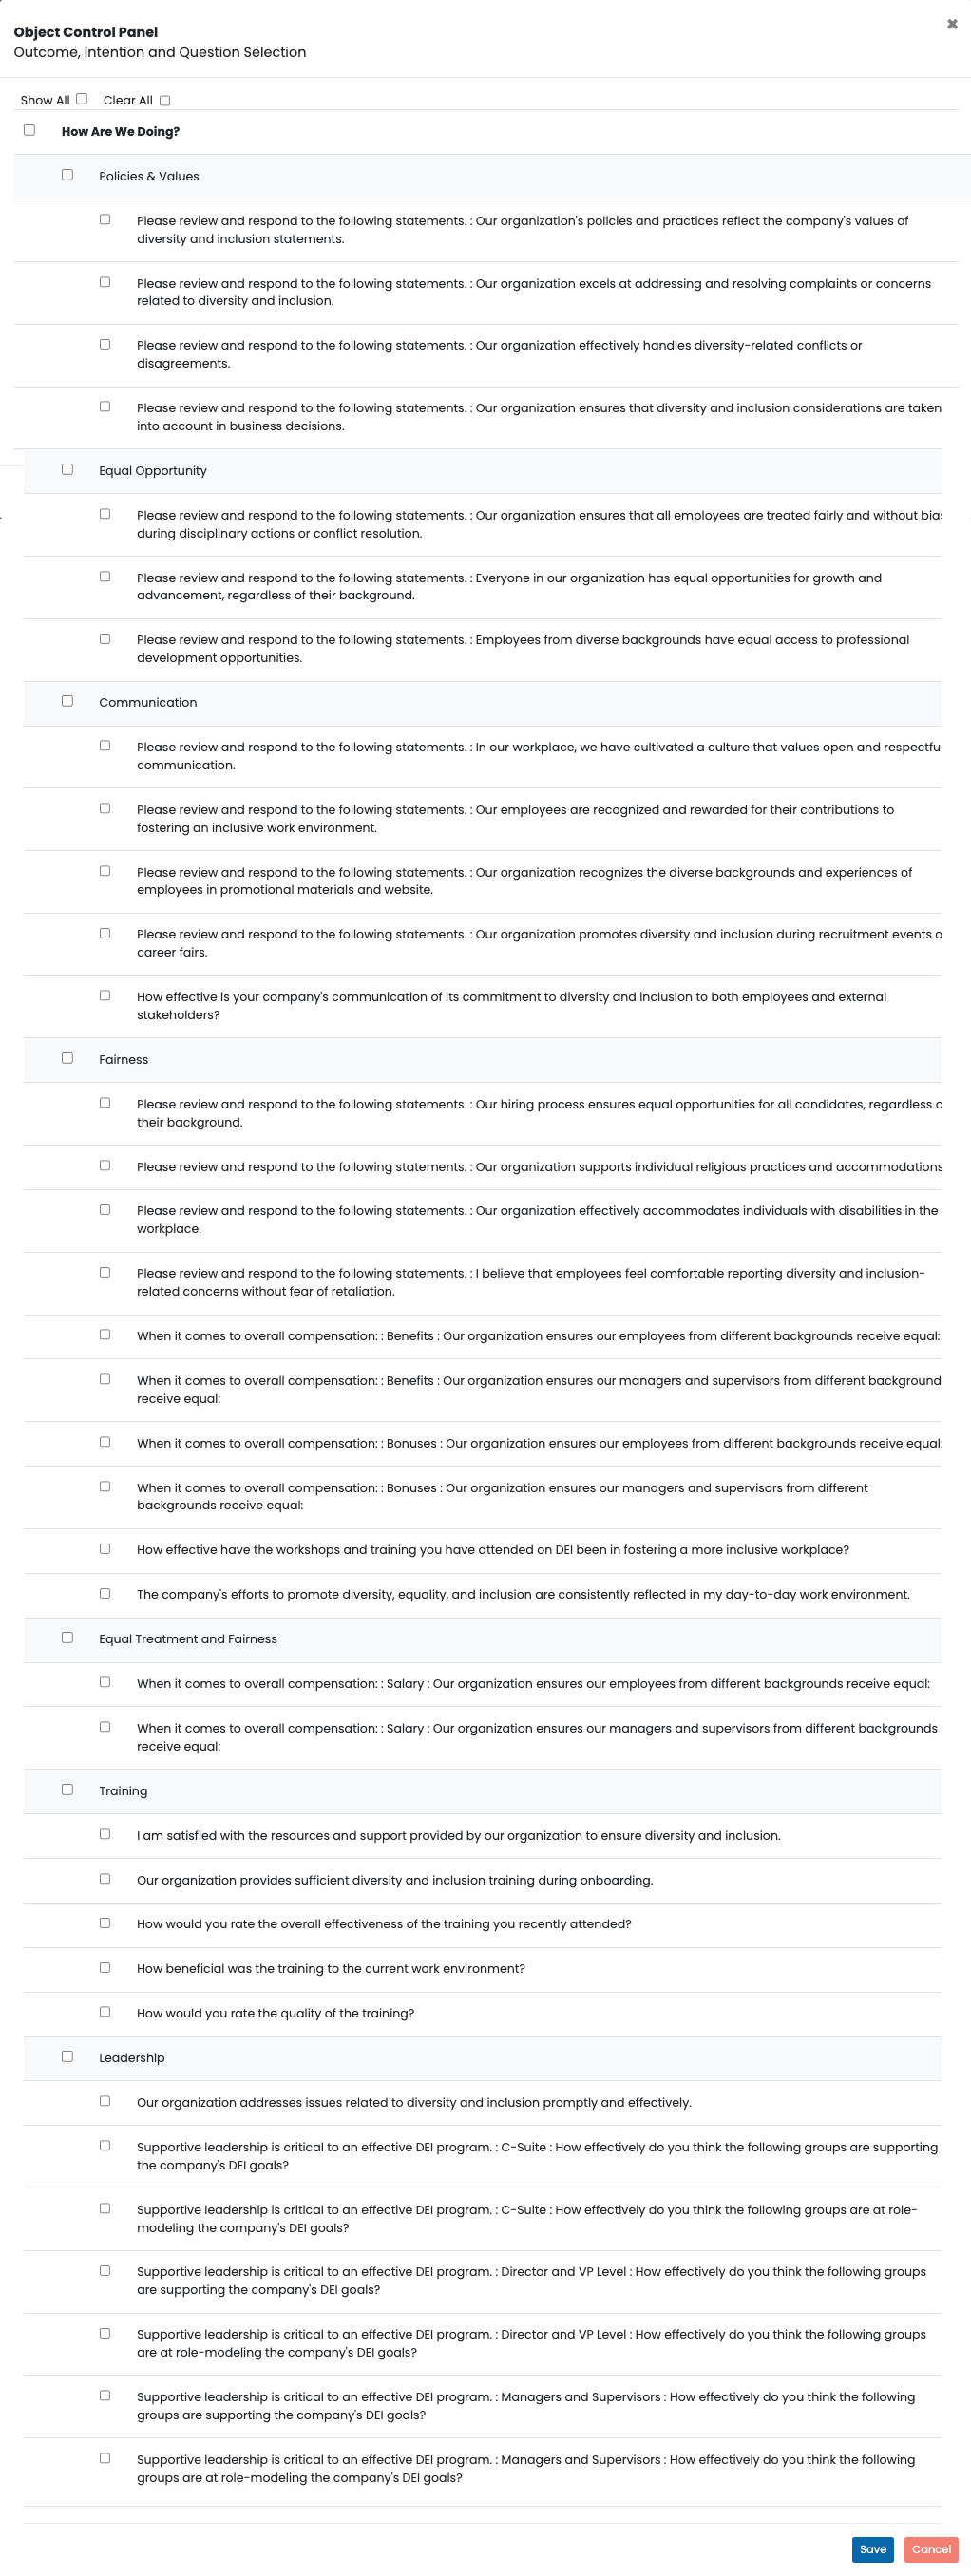
Object Control Panel
Again, Objects are the elements of the survey structure, the Questions, Intentions, and Outcomes. In the screenshot below we see the following:
- Outcome: How Are We Doing?
- Intention: Policies & Values
- Questions: Please review and respond to the following statements . . .
- Intention: Policies & Values
Click on the image to see a complete view of the objects from an example Diversity, Equity and Inclusion survey.