Table of Contents
NOTE: The Report Generator produces reports from templates created by the user; Therefore, you MUST have a template created before producing a report with the Report Generator. To be present in a report, a widget must:
- Exist in a report template, or it can be
- Added to a report while being created with the Report Generator
See these articles for the following related instructions:
Data points and objects are essential components of any IR Widget that displays data. Make sure to understand how they play a role in data visualization from this article:
Summary
The "Information & Graphic Block" widget serves as a multifaceted tool designed to enhance the presentation, comprehension, and engagement of reports. This widget allows users to combine textual information with graphical elements within a single block, facilitating a more integrated and visually appealing way to convey complex data and narratives.
Purpose
Here are some key purposes and benefits of using the Information & Graphic Block widget in reports:
Enhancing Data Presentation
- Visual Appeal: Combines text and graphics to create more engaging and visually appealing reports. Graphics can break up large blocks of text, making the report more reader-friendly.
- Data Visualization: Graphical elements like charts, graphs, and images can illustrate trends, patterns, and comparisons more effectively than text alone. This makes it easier for readers to understand and interpret complex data.
Improving Comprehension
- Contextualization: Accompanying text provides necessary context to the graphical elements, explaining the significance of the data and how it relates to the report's overall narrative or findings.
- Clarification: Text blocks can offer explanations for graphical data, clarifying any potential ambiguities and ensuring that the audience accurately understands the information being presented.
Facilitating Communication
- Storytelling: The combination of text and graphics allows for more effective storytelling, enabling report builders to weave a compelling narrative around the data. This storytelling approach can help to engage the audience and make the information more memorable.
- Highlighting Key Points: This widget can be used to draw attention to key findings or important data points within the report. By highlighting these elements through both text and graphics, the report can guide readers' focus to the most critical information.
Enhancing Report Customization and Flexibility
- Customizable Layouts: Users can tailor the layout of the Information & Graphic Block widget to fit the specific needs of their report, choosing how text and graphics are arranged for optimal impact.
- Adaptability: This widget can be adapted to various types of reports, whether they're focused on market research, financial analysis, project updates, or any other area that benefits from data-driven insights.
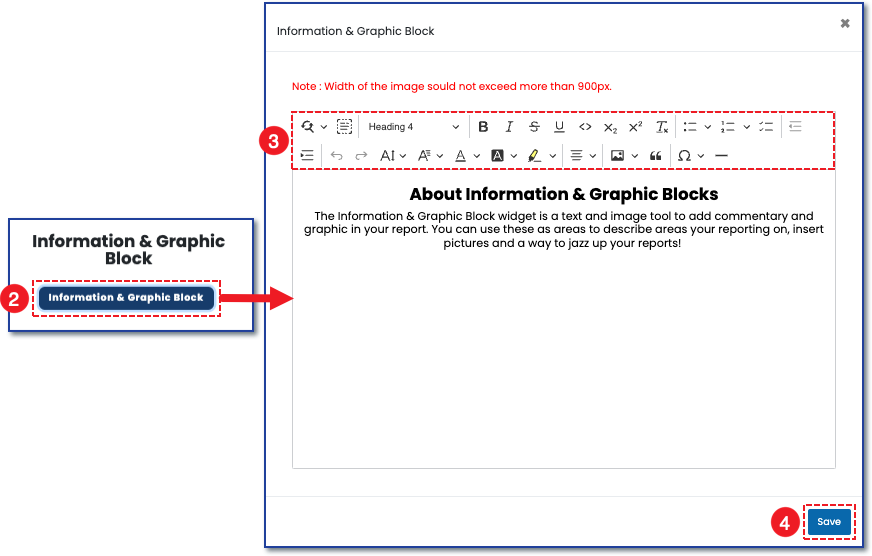
Information & Graphic Block Setup
1) To set up the information and graphic block, click the control panel icon to open the widget control panel.

2) When the widget control panel appears, click the Information & Graphic Block button to open the control panel.
3) Use the text and graphic editor at the top to add and modify text and images as desired.
4) Click Save when done.