Table of Contents:
NOTE: The Report Generator produces reports from templates created by the user; Therefore, you MUST have a template created before producing a report with the Report Generator. To be present in a report, a widget must:
- Exist in a report template, or it can be
- Added to a report while being created with the Report Generator
See these articles for the following related instructions:
Data points and objects are essential components of any IR Widget that displays data. Make sure to understand how they play a role in data visualization from this article:
Summary
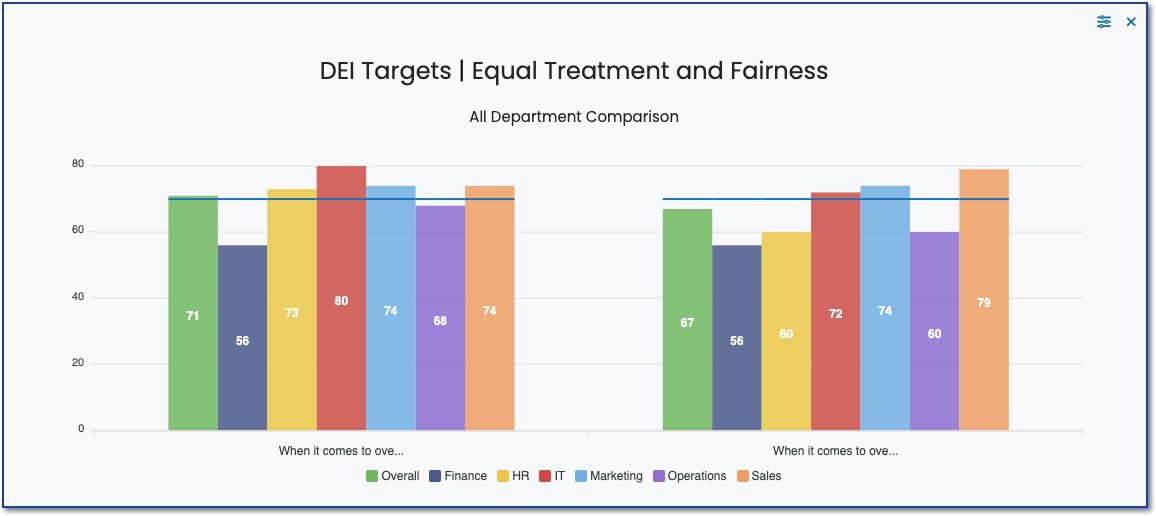
A Target Chart is an indispensable visual tool that can significantly enhance the presentation of survey data and enrich the analysis and interpretation of that data in the context of predefined objectives or benchmarks. This chart is crucial in assessing performance, guiding strategic decisions, and effectively communicating key findings.
Purpose
Performance Assessment
- Measuring Achievement: Allows for a clear visualization of how survey responses or measured metrics stack up against set targets, facilitating an immediate understanding of achievement levels.
Goal Setting and Progress Tracking
- Setting Benchmarks: Helps establish clear benchmarks or goals expected from survey responses, enabling stakeholders to have a quantifiable measure of success.
- Tracking Progress: Offers a straightforward way to monitor progress over time towards these targets, making it useful for longitudinal studies or continuous feedback mechanisms.
Insight and Decision Making
- Identifying Gaps: By highlighting discrepancies between actual results and targets, a Target Chart can pinpoint areas that need attention, guiding strategic decisions and actions.
- Enhancing Insights: Provides deeper insights into survey data by presenting what the data shows and how it relates to the expectations or goals of the survey.
Communication and Reporting
- Simplifying Communication: Translates complex data sets into a simple, intuitive visual format, making it easier to communicate findings to a broad audience, including those without technical expertise.
- Supporting Data-Driven Stories: Enables the creation of compelling, data-driven narratives that can effectively convey the story behind the survey data, illustrating successes or highlighting opportunities for improvement.
Motivation and Engagement
- Motivating Action: By comparing actual outcomes to targets, teams, and individuals can be motivated to take action. This helps to maintain positive trends and address areas falling short of goals.
- Engaging Stakeholders: Provides a clear and engaging visual representation for stakeholders to quickly grasp the performance levels, fostering a greater understanding and engagement with the survey outcomes.
Setup
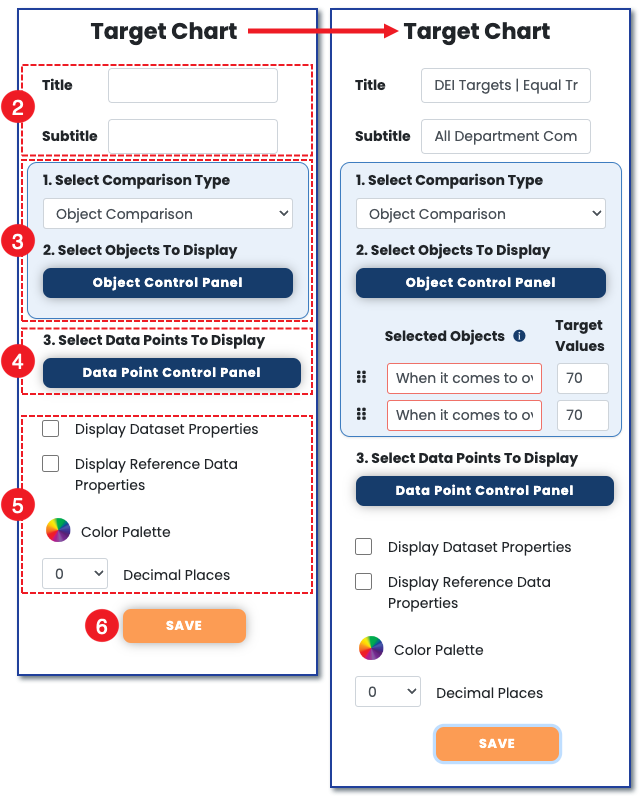
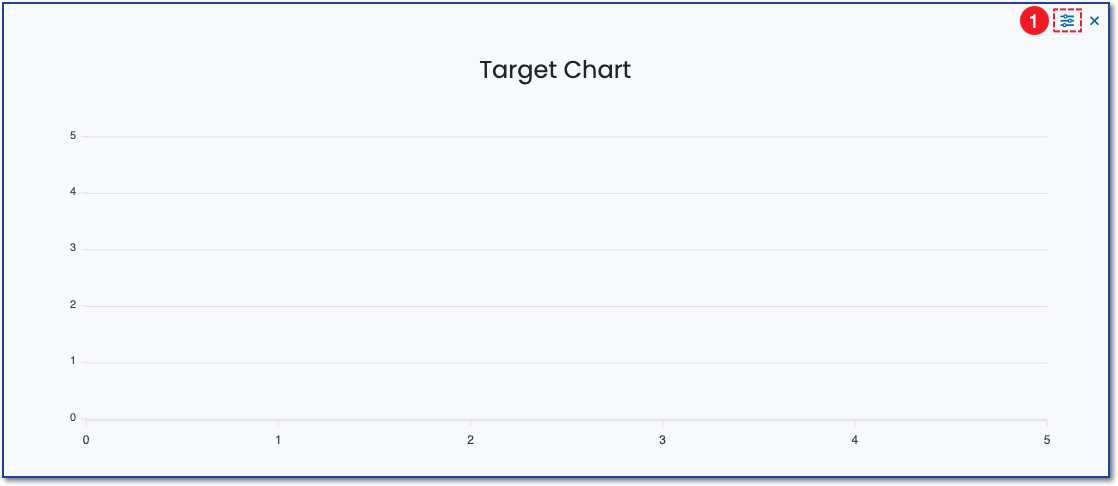
1) To set up the target chart, click the control panel icon to open the widget control panel.
 2) Once the control panel opens, add a title and subtitle to the target chart. Titles can be relevant to the survey section the chart is reporting on.
3) Select to compare either objects or data points.
Data points consist of various components such as the company, department, participant, reference data, and benchmark options.
Objects consist of the outcomes, intentions, and questions the survey comprises. Ensure a target value is added to populate lines at the same level across all graphs.
4) Once an item is selected in #3, the opposite is presented in #4.
5) Choose additional display preferences.
6) Save your settings.