
Reports generated from charts that have been populated with random response test data can be saved and accessed later. To learn how to populate your assessment with random response test data see this article.
Charts and reports that have been generated with random response test data can be saved and accessed later.
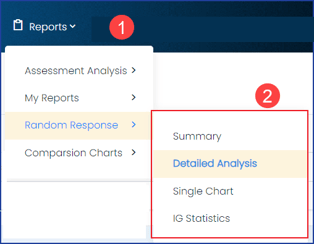
1) Once your reports have been created and saved, return to them by selecting Reports > Random Response. See this articleon how to create your reports.
2) All report types will be listed. Selecting one will bring you to all your saved reports of that type.
 Random Response - Accessing Saved Reports
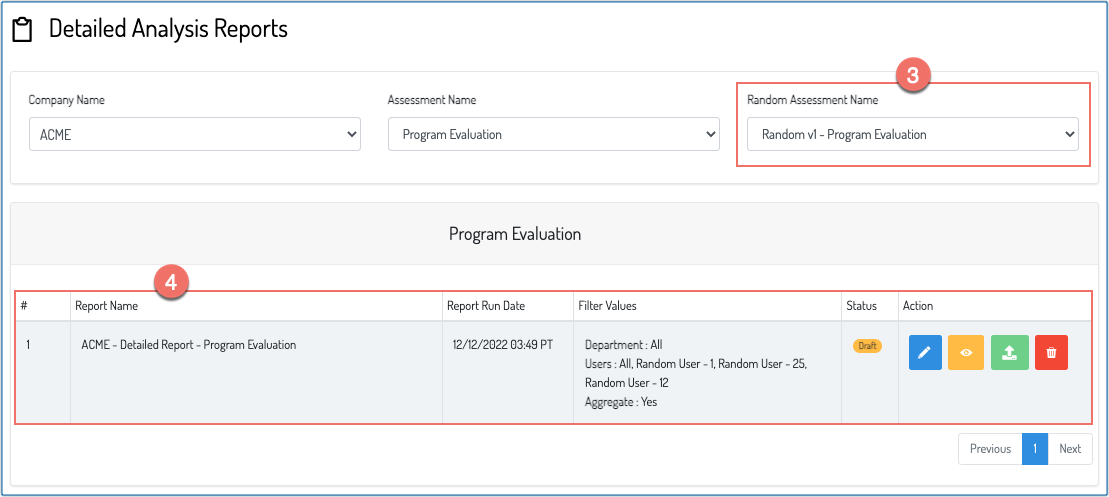
3) In the top right corner choose a random response data set from the dropdown menu to see its corresponding reports. If you have only populated the chosen assessment with random test data once, then no other options will be available.
4) After selecting a chart type, the list of reports will populate. From left to right the columns offer the following information:
 Random Response - List of Saved Reports
- The number of reports saved
- The report name
- The date the report was initially ran
- The filter attributes
- The status of the report: Draft or Published
- Actions you can take on the reports: Edit, Preview, Publish, and Delete.
Random Response - List of Saved Reports