Table of Contents:
There are five distinct attribute sections. Each section has a header on the left side for quick access to edit the attributes in that section. These attributes are available when creating a new survey and when returning to review and edit the survey attributes. Each of these sections is explained below in detail.

Section 1 | Survey Info
- Company Name: The company to which the survey is associated with. This is only applicable to Enterprise plan subscribers. All other plans will have their company named fixed in this dropdown.
- Survey Name: The title you give the survey you are creating.

Section 2 | General Settings
These settings determine the basic structure of your survey.
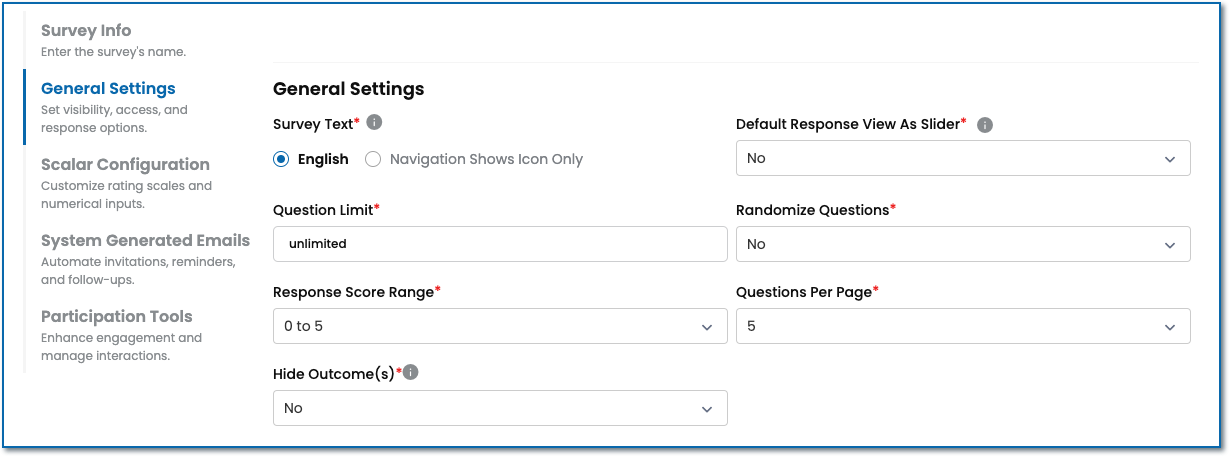
- Survey Navigation Text - The text for survey navigation can be presenting in the English language and navigation icons or with icons only. Note this setting does not determine the language your survey is written. With Metolius you can write your survey in any language.
- Default Response View as Slider - By default, response options are displayed as a vertical list with radio button selections. If you prefer to set the default display to a horizontal slider, select "Yes" from the dropdown menu. Additionally, for each question you create, the option exists to configure the response choices as a horizontal slider.
- Question Limit: The question limit will be automatically set by your subscription plan level.
- Randomize Questions: Choose yes to turn on question randomization. Depending on the flow of the questions in a survey, a respondent might feel inclined to think in a certain direction. Question randomization solves this problem by presenting survey questions randomly to the respondent. Note that randomization is not available to Free subscribers.
- Response Score Range: Select from four built-in range options or choose Custom to specify your range in the From and To fields. For more details, see the scoring and response score range article.
- Questions Per Page: Select the number of questions to display per page.
Section 3 | Scalar Configuration
Just like the imperial and metric measuring systems, your data needs a scale on which to be measured. The scale on which you measure is completely customizable from the names of the scale levels to the point range and color associated to those levels, allowing you to create a configuration that makes the most sense for your survey.
The 5-level scalar configuration below is the default when you create a new survey. The scalar is completely customizable in relation to the number of levels (up to 20), the names of the levels, the score range and color associated to each level.
See this article to understand the scalar in more detail.
Adding 10+ scalar levels will force the color for each scalar level to be selected manually versus through the auto-generated color palette.
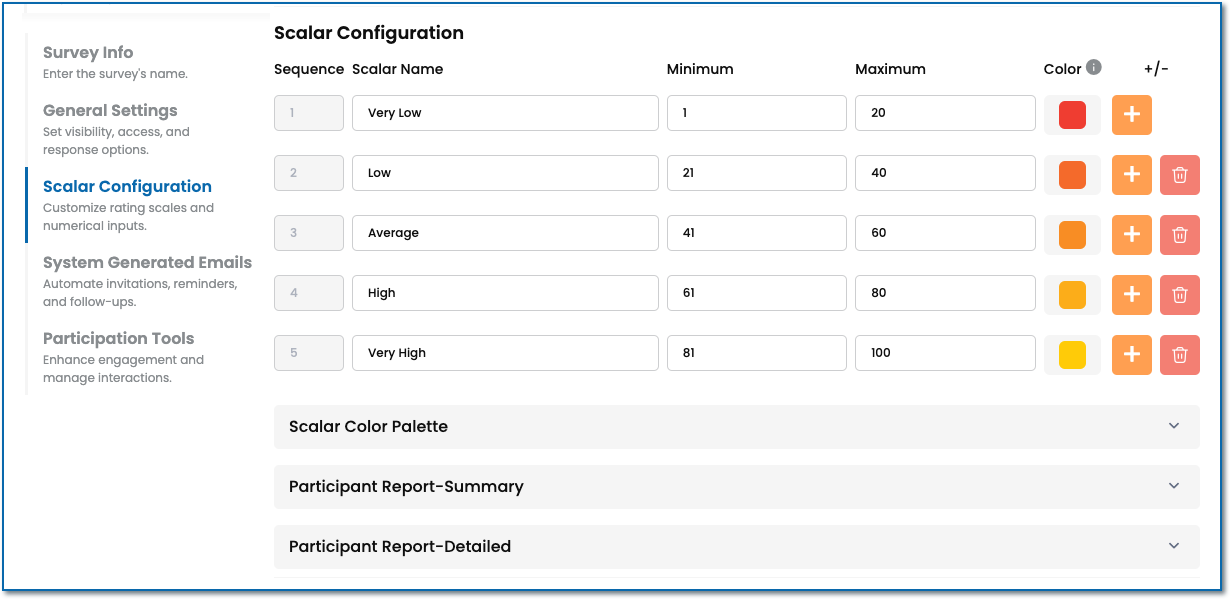
3.1) Scalar Color Palette
To select your scalar colors, expand the Scalar Color Palette menu .
The 'Sequential', 'Diverging', and 'Data Visualization' palettes are fixed and generated by Metolius, while 'My Colors' can be set in the system Default Settings. 
3.2) Participation Reports
Expand the Participant Report menu, either the Summary or Detailed, to build reports that can be shared with the users upon their completion of the survey. Both report formats are similar in text components but different in the chart that is shown. Click the Preview button to view what the report will look like when shared with the user.
Report Title and Commentary
Add a report name as well as opening and closing comments. that will appear in the generated report.
3.2.1) Chart Options
- Choose data display options with chart type
- where to display the legend
- The display font size
- Where to display the data label
- control the scalar color opacity
- Switch axis of the chart
- Determine the data label color

These color options are similar to the scalar color selection above, but they instead determine the color of the data set that is presented on the scalar.

3.2.3) Chart Options Preview
Below is the chart options display preview for the selections made above in chart options and chart color. To preview what the entire report will look like, use the blue Preview button below the chart preview. 
Section 4 | System Generated Emails
These settings determine the System Generated Emails that will be sent to the participants taking your survey. For each survey created, you can either use the default email messages set up within the system Default Settings, or you can override those defaults by adding messages unique to the survey you are creating. The purpose of each email is described below. Those marked with an asterisk are required to publish your survey.
- Pre-Start: Sent before the email that assigns the survey, this email can be used to notify the user that they will soon be assigned an survey and what to expect.
- Assign*: Shares a unique username and password with the user. These credentials are used to log in and take the survey.
- Reminder*: Reminds the user to take the survey if they have yet to start or complete the survey. Reminders can be triggered manually from the survey Progress Report, or be set up to send automatically when the survey is scheduled.
- Thank You*: Sent after the user completes the survey.
- Email Footer: Set up an email footer that will populate all the above emails.
The image below is the Assign email expanded to show the compose options. The Subject line and email body have a default message that can be edited. Options at the top allow for copying an assign message from the system Default Settings or from Resources. The Search and Add from Resource option will give you the choice to use a message that was previously saved to your resources or use one from resources generated by Metolius. Make sure to review all emails closely as they each share different content and different content arrangements.
After composing a subject line and message content, the message will automatically save. However, make sure to click either Save or Save and go to Questions buttons at the very bottom to ensure all attributes are saved before leaving the Create New page.

Section 5 | Participation Tools
These settings also communicate with the users taking the survey. The purpose of each is described below:

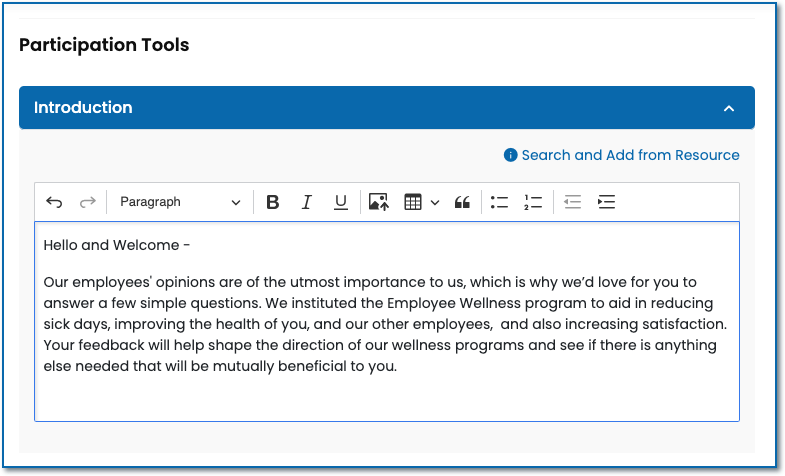
5.1) Introduction
When a participant begins taking a survey, this introduction will be presented first and should be used to explain the purpose of the survey. Keep the introduction concise but insightful so the participant understands why their participation is important as this will influence them to complete the survey. Use the Search and Add from Resource link to pull in introductions from either ones you have saved to My Resources, or from what Metolius offers.
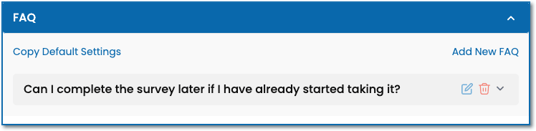
5.2) FAQ
Set up Frequently Asked Questions (FAQ) to aid your participants in understanding their involvement in case they have questions. This may also help prevent unnecessary outreach from the participants taking the survey to your designated help contact. Find below the expanded FAQ menu with an example FAQ included. From here you can copy from default settings, Add New, or Edit/Delete existing FAQs you've already added.
Find below the Add FAQ dialog box that appears from clicking the Add New FAQ link under the expanded FAQ menu with an example FAQ in place.

5.3) Help Contact
Share contact information to help your participant reach out in case they need assistance related to the survey. Expand the Help Contact menu (below) and click Add New Help Contact, or copy contact info previously added to Default Settings by clicking Copy Default Settings. Edit or delete existing Help Contact info by clicking either the pencil icon or the trash can icon.
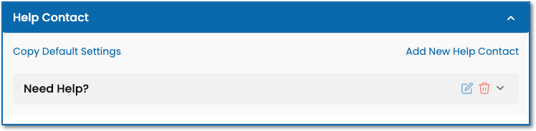
Once the Add Contact dialog box appears (below), enter a title and description then click the Add Contact button at the bottom.

5.4) Progress Bar
Inform your users of their progress in completing the survey by setting intervals where confirmation messages and celebratory graphics will be displayed.
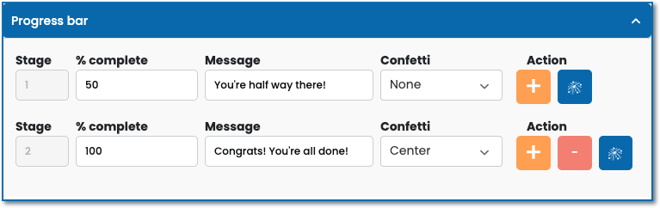
- How many stages your progress bar will have
- The percent complete for each stage
- The encouraging message that will display
- Whether or not to display a burst of confetti when that stage is reached.
- Adding (+) or removing (-) stages to the progress bar, and previewing the confetti display option (blue).
- If you do not want a Progress Bar, simply remove all stages using the red minus button.
Save Your Survey
Click the Save and Go to Questions button to save the survey and move on to adding outcomes, intentions, and questions. Click the Cancel button to end the operation. Click the Save button to save your work and build the survey later.