.png?height=120&name=Profile%20Blue(2).png)
Learn how to analyze survey data from Data Analytics questions by understanding selection options, applying filters, and interpreting results effectively.
Accessing Analytics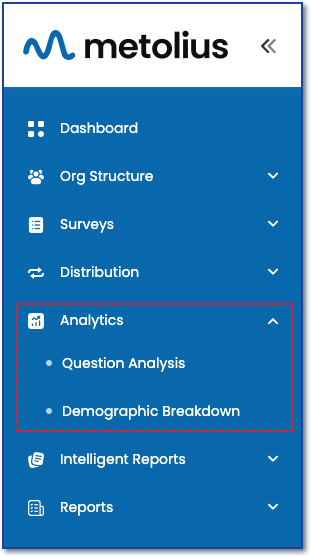
The first step to visualizing any of your survey data is to choose the survey you wish to analyze.
To access data analytics, first expand the Analytics menu in the main navigation sidebar.
For Data Analytics questions choose the Question Analysis submenu.
🔗OPTIONS FOR DATA ANALYSIS🔗
See the following articles for more information on understanding the three question categories for data analysis and how to access Question Analysis for Information Gathering questions and Demographic Breakdown for Demographic questions.
See Understanding the Question Analysis Framework and Analytic Controls: How to Use Filter and Compare for a deep dive into all the options and Analytic controls within Question Analysis. This article focuses solely on analysis of the the Data Analytic questions.
Data Analytic Question Analysis
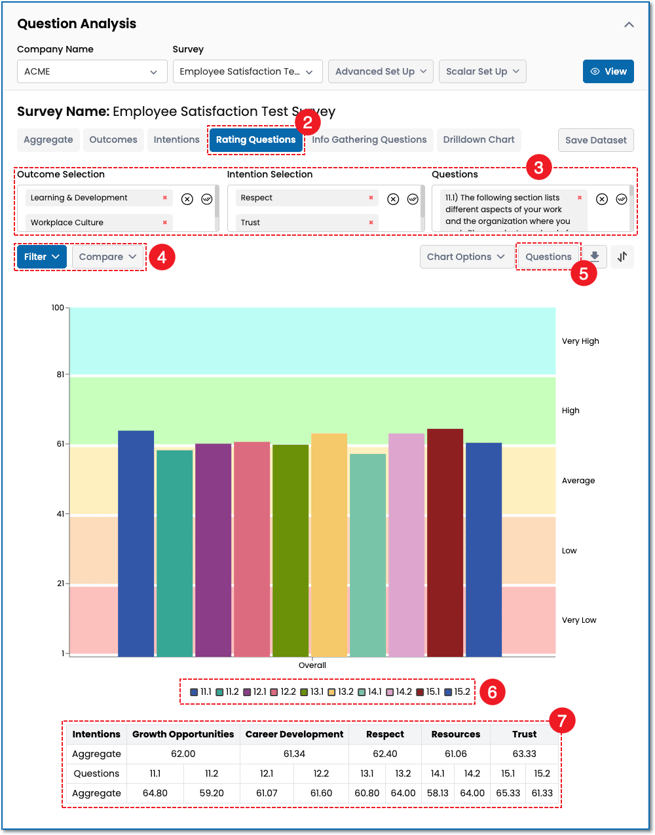
After selecting the Question Analysis submenu, you will be brought to the Question Analysis page.
- Survey Selection - Choose an option from the Company Name dropdown menu if on the Enterprise subscription plan, all other plans will have your company pre-populated. Next, choose an option from the Survey drop down menu. Only surveys that are active and receiving responses or closed for responses will show up in the list. Click the View button.

- The survey selected and it's data are now on display in the chart among the analytic controls. This article reviews controls for data analysis at the question level for data analytic questions. Start by selecting the Rating Questions button.
- Use the Outcome, Intention and Questions selection boxes to choose which questions are displayed in the chart. When you select an option in one box, the other boxes will update automatically to match your choice as the Outcome > Intention > Question elements are a nested structure that correlate to one another. For example, in the screenshot below, selecting the Learning & Development and Workplace Culture outcomes results in the display of the Respect and Trust Intentions as well as the ten corresponding questions.
- Use the Filter and Compare options to filter the data set on display or compare against others. Review the 🔗Filter and Compare🔗 article for a deeper explanation on these features.
- Reference the Question List by clicking the Questions button. A dialog box will display all the questions and their corresponding numbers.
- The chart legend displays the question number only. To see the full question text, reference the question number within the Questions selection box or the Questions List mentioned above in item #5.
- The Crosstab shows the same data as the chart but in a matrix format.